Das-Meter
Das-Meter shows live Meters for what your computer plays, or for single tracks from your DAW: Waveform, Spectrum, Spectrogram, Loudness Meter, Stereometer, Goniometer, Phase Scope, Cepstrum, Oscilloscope, Tonal Balance, Tuner, Stereo Bands and Needle Meter. It runs on its own, next to any app or DAW, on macOS, Windows and Linux. It's free and open source (MIT OR Apache-2.0). Designed by Punktmidi. If it helps your music, you can support it with a donation.
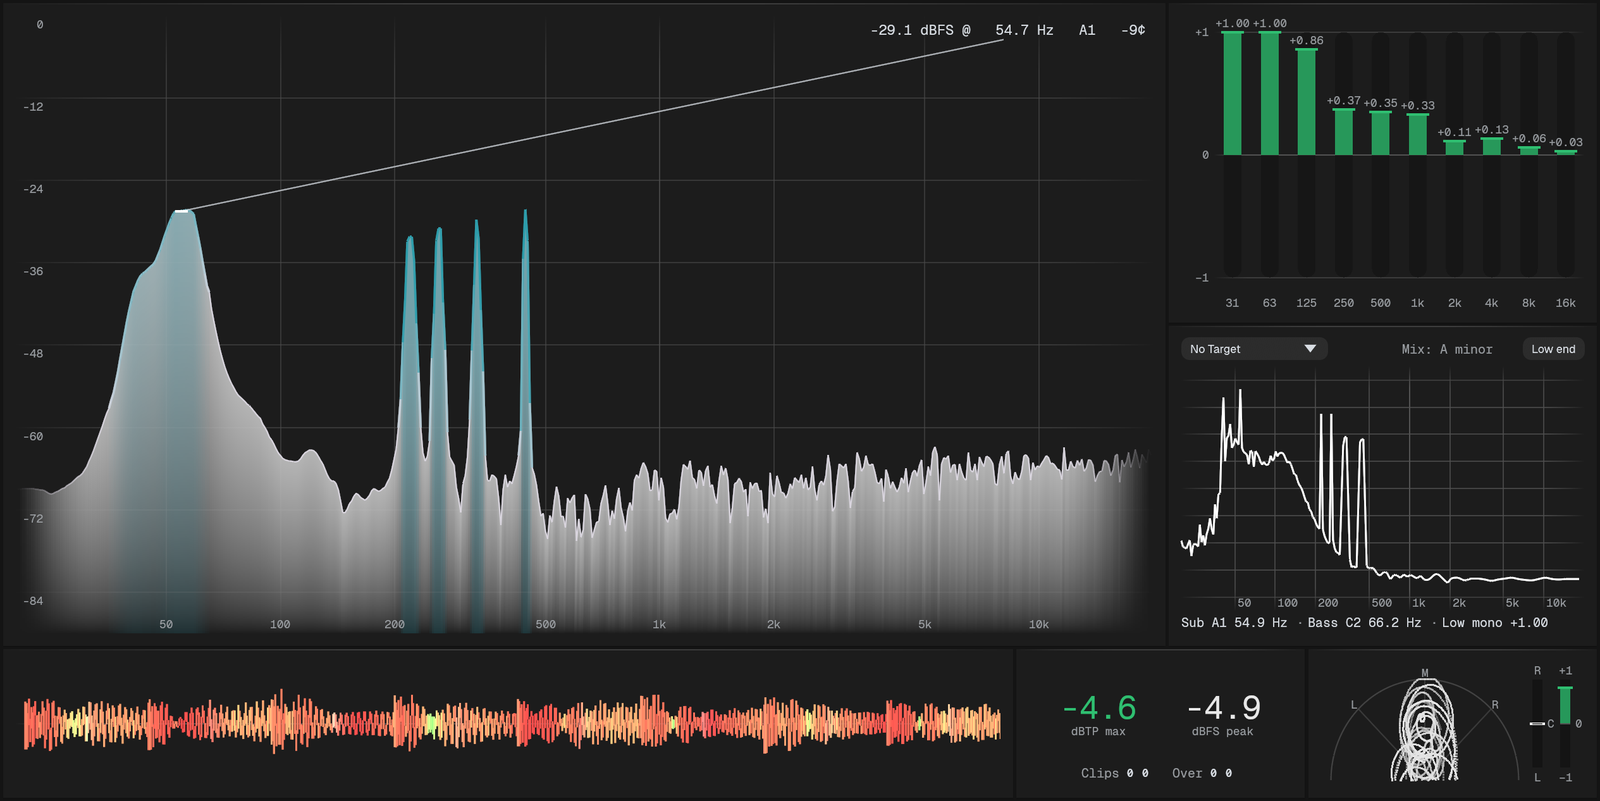
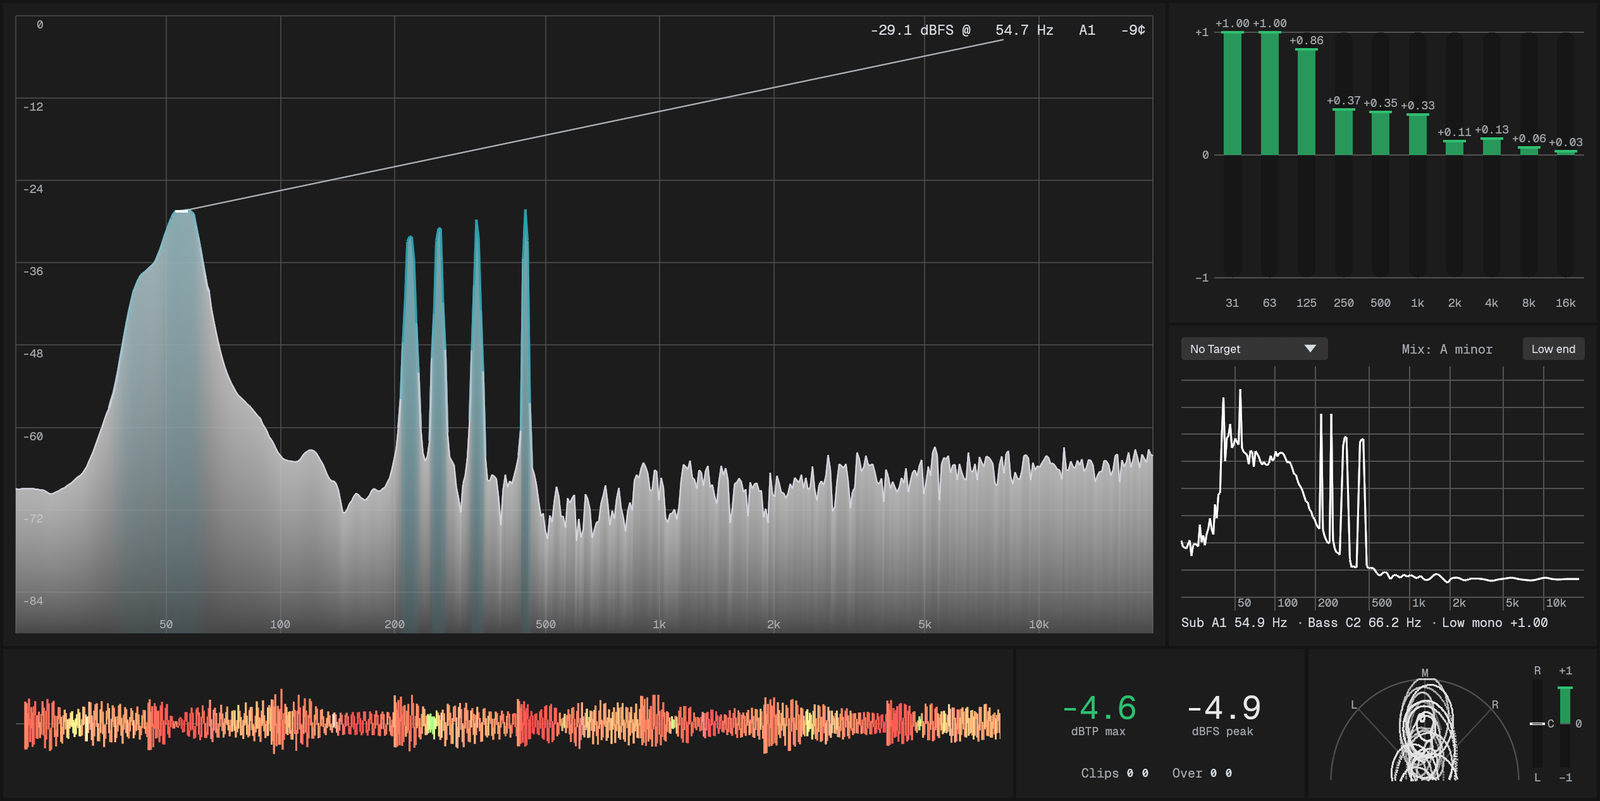
Every Theme is drawn in one of two Looks: Smooth (the default) or Classic, the flat look of earlier versions. Colours, styling and the Look are all yours to change; see Themes.
- New here? Start with Getting started.
- What does each Meter show? See Meters.
- Using a DAW? See Send Plugins.
- What do the numbers mean? See Measurements.
- Comparing with reference songs? See Tonal Balance and A/B.
- Kick and bass fighting? See Kick and bass in the Phase Scope.
The Loudness Meter measures to ITU-R BS.1770-5 and EBU Tech 3341/3342, tested on those standards' cases with signals we generate ourselves.
Getting started
Download
Get the latest release from GitHub Releases:
- macOS (14.6 or newer, Apple silicon and Intel):
Das-Meter-<version>.dmg. - Windows (10 and 11, x64):
Das-Meter-<version>-windows-x64-setup.exe. - Linux (x86_64, e.g. Arch):
das-meter-<version>-linux-x86_64.tar.gz. Unpack it and run./das-meter. System Capture needs PipeWire (the default on Arch, Fedora and current Ubuntu). The Bar is an ordinary always-on-top window there (Wayland doesn't let apps dock themselves), there's no menu bar or tray icon, and no Send Plugin for Linux yet.
Install on macOS
Open the DMG and drag Das-Meter to Applications.
Install on Windows
Run the installer and allow it to make changes (it installs for everyone on
the PC). Untick CLAP or VST3 if your DAW doesn't need that Send Plugin
format. Double-clicking a .dasmeter-preset file afterwards imports it.
Until the installer is code-signed, Windows SmartScreen asks once: choose More info ▸ Run anyway.
Open Anyway
The first time you open Das-Meter, macOS says it can't check the app for malicious software. That's expected, and you only need to do this once:
- Open Das-Meter once and close the message.
- Open System Settings ▸ Privacy & Security and scroll down.
- Next to "Das-Meter was blocked…", click Open Anyway, then confirm.
Why: Apple only skips this step for apps signed with a paid Apple Developer ID and sent to Apple for checking ("notarized"). Das-Meter is open source and signed with its own certificate instead, so you can read exactly what it does. Once there's a Developer ID, this step goes away.
The Send Plugin comes inside the app, so this is the only step like it: Das-Meter copies the Send Plugin into your plug-in folders itself (see Send Plugins).
First launch
Das-Meter opens as a Bar docked to the top of your screen (the Producing Top-Bar 1.0 Preset), with a welcome card next to it:
- Start listening starts System Capture. On macOS, this is when macOS asks for permission. Das-Meter never records or saves audio.
- Install Send Plugin… (macOS) puts the Send Plugin in your plug-in folders for your DAW.
- ✕ closes the card without listening; each Meter then shows a small Start listening button.
You can bring the card back with Help ▸ Show Welcome.
Right-click any Meter for its settings. The settings panel (Das-Meter ▸ Settings…, ⌘,) has everything else.
On macOS, Das-Meter also has an icon in the menu bar, so you can turn off Show in Dock. Launch at Login is off until you turn it on.
Listen to
Listen to decides where every Meter gets its audio. It's app-wide: Meters never mix the two.
- System Capture (the default): everything your computer plays through its default output.
- Send Plugins: the audio of the DAW tracks you put a Send Plugin on. Each Meter picks its own.
Switch in Listen to in the menu bar (macOS) or in the settings. While you listen to Send Plugins, System Capture pauses.
System Capture
System Capture follows your default output device. If you switch outputs or the sample rate changes, the Meters start over and say "Output changed: reset".
macOS permission
On macOS, System Capture needs Screen & System Audio Recording permission. macOS asks when you press Start listening. Das-Meter only reads the audio to draw Meters; nothing is recorded or saved.
If you said no, or the Meters stay flat: open System Settings ▸ Privacy & Security ▸ Screen & System Audio Recording and turn Das-Meter on. The "Hearing nothing?" hint has a button that opens this page.
Hearing nothing
After about 10 seconds of silence on System Capture, Das-Meter shows a hint. Common reasons:
- Nothing is playing, or it's playing on another output device than the default one.
- Your DAW uses ASIO (Windows) or another exclusive-mode driver. That audio bypasses the system mixer, so System Capture can't hear it. Use Send Plugins instead: the hint switches in one click.
- On macOS, the permission is off (see above).
Send Plugins
A Send Plugin is a small plug-in you put on a DAW track. It forwards that track's audio to Das-Meter and shows no Meters itself. Use it when System Capture can't hear your DAW (ASIO), or to meter single tracks.
It comes as CLAP, VST3 and AU (macOS). In your DAW it's called Das-Meter Send.
Install
macOS: Das-Meter carries the Send Plugin inside the app. Choose Das-Meter ▸ Install Send Plugin… (or the button on the welcome card). It copies the plug-ins into your own plug-in folders:
~/Library/Audio/Plug-Ins/CLAP~/Library/Audio/Plug-Ins/VST3~/Library/Audio/Plug-Ins/Components(AU)
No password is needed. Then rescan plug-ins in your DAW (or restart it) and add Das-Meter Send to a track. When Das-Meter updates, it updates the installed plug-ins too, and tells you to restart your DAW.
Windows: the installer puts the Send Plugin in the standard folders,
C:\Program Files\Common Files\CLAP and …\VST3, with a checkbox for each
format. Updating Das-Meter updates them too; if a DAW has the plug-in open,
the new one takes its place when you next restart Windows.
Naming
Each Send Plugin has a name and a colour, and keeps both when you reload the project:
- the name you type in its window, else the DAW's track name, else an animal name such as "Otter";
- the DAW's track colour, else a random one.
Duplicating a track gives the copy a new Send Plugin.
Listening
Switch Listen to to Send Plugins. With one Send Plugin, every Meter shows it. With several, each Meter shows a list to pick from; right-click a Meter and use Source to change it, or Use for all Meters. Turn on Show Source label to see which one a Meter shows.
The first time a Send Plugin sends while you listen to System Capture, Das-Meter offers to switch.
Waiting for
If a Meter's Send Plugin goes away (its DAW closed, or the track was removed), the Meter dims and says Waiting for name. It picks the Send Plugin up again when it's back.
Meters
Das-Meter has thirteen kinds of Meter. Right-click one for its settings; the settings panel has the same settings for every Meter, and a few more. Step-by-step guides: Tonal Balance and A/B and Kick and bass in the Phase Scope.
Waveform
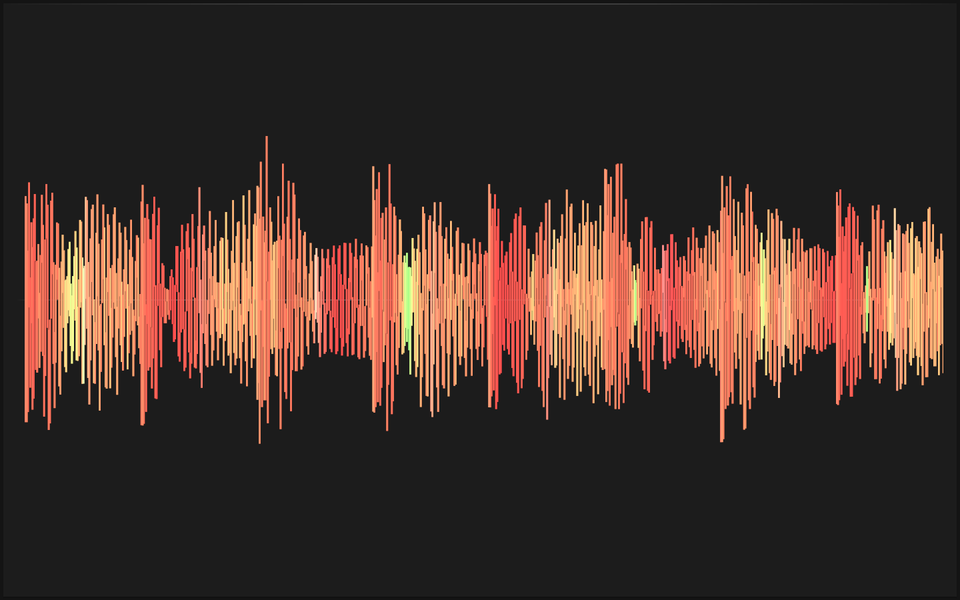
The audio over time, coloured by frequency band (low, mid, high). Settings: Channels (mono, Left/Right, or Mid/Side), time span (1–30 s), display gain and the two band crossovers. Boost quiet input brings a quiet signal up to a good height (by up to +30 dB on top of the gain): it rises slowly and comes down at once, so a loud hit is never cut off.
The Waveform stays put in time and a camera glides over it: each slice of the audio is drawn once, where it belongs, and only the view moves. So it scrolls smoothly, by fractions of a pixel, without any part of it shimmering.
Spectrum
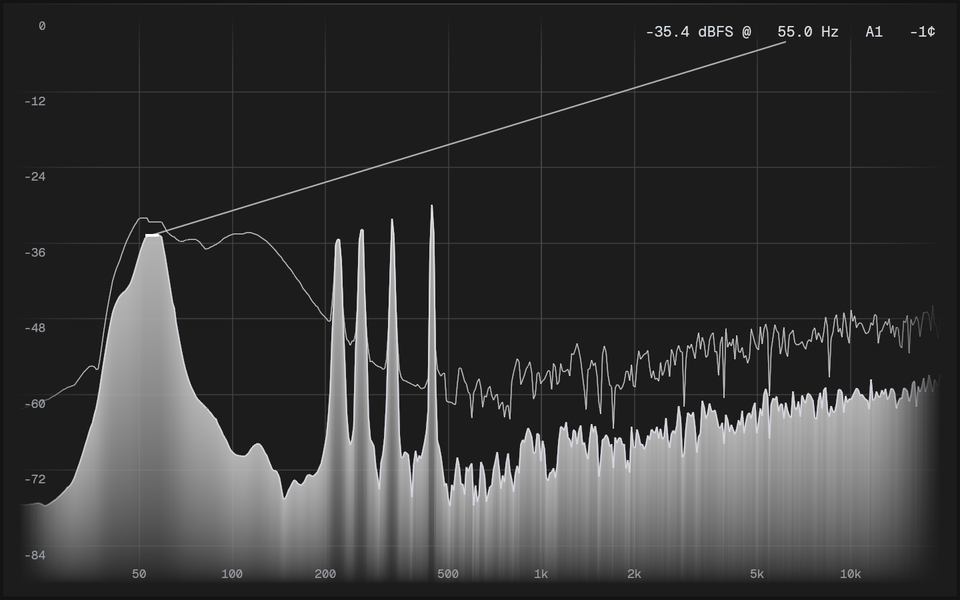
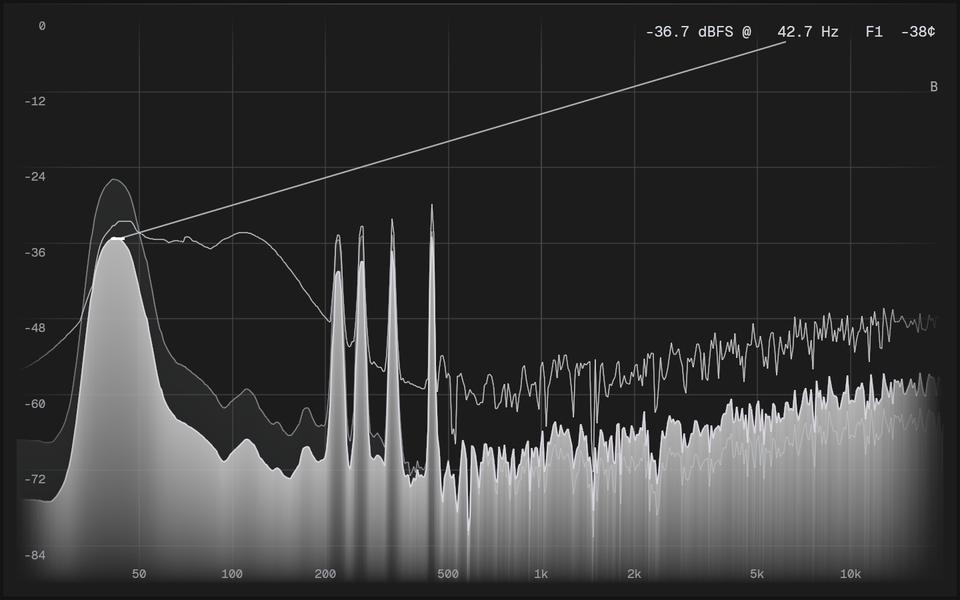
How loud each frequency is. Settings: Channels, FFT size, window, Slope (0, 3, 4.5 or 6 dB per octave, pivoted at 1 kHz), Smoothing, Style (a line, or bars at 3, 6 or 12 per octave), attack and release, Peak hold, Peak line, and the shown frequency and level ranges. With Peak line on, the loudest peak's level, frequency and note stay at the top right, and a thin line runs from the peak to them. The peak is the music's loudest as it is, usually the kick or the bass, not as the slope tilts it: changing the slope moves the curve, never which peak the line follows. Mouse readout (on by default) reads any frequency and its note under the mouse. Drag a box over the Spectrum to zoom into it: a zoom window opens in the other half of the Meter, showing the box's frequencies and levels larger, with its own scale and a finer frequency resolution (the largest FFT size). Its × closes it. A tone keeps its level in the zoom window, but noise looks lower there, since each point covers fewer frequencies. While the mouse is over the Spectrum it falls slower and holds its peaks (Slow down under the mouse), and the peaks that keep sounding get a dot with their note; the one nearest the mouse also shows its frequency and level. Only peaks that stand out for a couple of seconds are marked, and a dot stays where it was found. The zoom window marks its peaks the same way. Colour ▸ Steady harmonics makes harmonics that keep sounding glow brighter. Their colours, Spectrum peak dots and Spectrum harmonics, are with the Spectrum's other colours in the Theme and the Meter's own colours. With two traces (Left and Right, or Mid and Side), the second one's colour is Spectrum R / Side.
Overlay Source and collisions
Listening to Send Plugins, a Spectrum can show a second track on the same graph: pick it under Overlay Source in the Meter's menu (any other Send Plugin from the same DAW). It's drawn as a line in that track's colour, named at the top right.
Where the two collide, both loud at the same frequencies and close in level, a strip along the bottom of the Spectrum is marked in the Spectrum collisions colour, more solid where both are louder: kick and bass on the same low notes, vocal and synth in the same mids. A frequency collides where both are over Collisions above (−50 dB by default, on the Spectrum's own scale, slope included) and within 6 dB of each other. It's a plain comparison of levels, not a model of how the ear masks one sound with another.
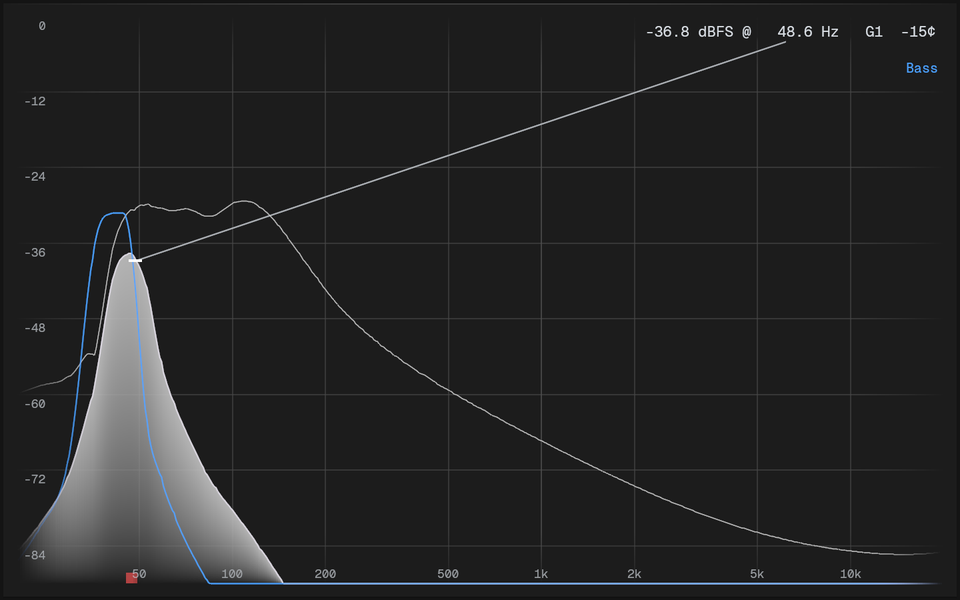
Long-term average and Reference curves
Long-term average draws a second, calmer line beside the live trace: the average over the last 3 s, 10 s or 30 s, or over everything since you last reset it (Whole). Silence is left out, so a pause doesn't pull it down. Reset long-term average in the Meter's menu starts it over.
Reference curves are in the Spectrum's settings (Settings… in its menu): with the long-term average on, play a reference track, type a name and press Save curve to keep that average as a curve. Pick one under Show and it's drawn dashed behind the live trace, with the Spectrum's slope, so you can compare your mix with it. Each Spectrum remembers its curve in the Preset, and an exported Preset takes its curves along. Curves are files in the curves folder:
- macOS:
~/Library/Application Support/Das-Meter/curves - Windows:
%APPDATA%\Das-Meter\curves - Linux:
~/.config/das-meter/curves
A curve is stored without the slope, 24 points per octave from 20 Hz to 20 kHz, so changing the slope or FFT size later doesn't spoil it.
Loudness Meter
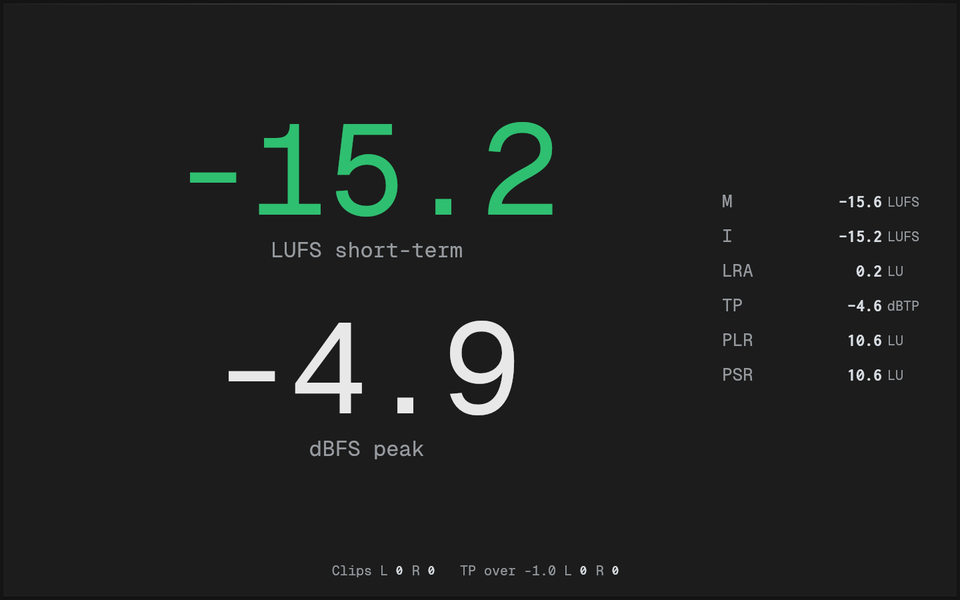
How loud the audio is: momentary (M), short-term (S) and integrated (I) LUFS, loudness range (LRA), true peak (TP), and the peak-to-loudness ratios PLR (true-peak maximum − integrated) and PSR (the last 3 s' true peak − short-term). By default it shows numbers only: two big numbers, the loudness (short-term LUFS unless Big reading picks momentary, integrated or true peak) and the sample peak in dBFS, with the other readings as plain rows. Thin bars adds a thin bar beside each big number. Turn on Show bars for the peak and RMS bars beside (or under) the numbers. Where there's room, the loudness graph shows the LUFS reading over the last 10 to 120 s, with the target and integrated lines. Settings: a Target loudness, Show true peak, Show LRA, Show PLR and PSR, Loudness graph and its span, the RMS window, peak hold (or Hold peaks until reset) and the bar range. Click the Meter to reset its integrated loudness, LRA, maxima and counters.
With the bars on, Scale picks how they read: Peak (sample peak and RMS in dBFS, with the LUFS bar), VU (0 VU at −18 dBFS by default, adjustable), a PPM (DIN, Nordic, BBC with its marks 1 to 7, or EBU) or the K-System (K-12, K-14, K-20: RMS with 0 at −12, −14 or −20 dB, turning colour above 0 and above +4). Each has its standard timing and numbers; see Measurements.
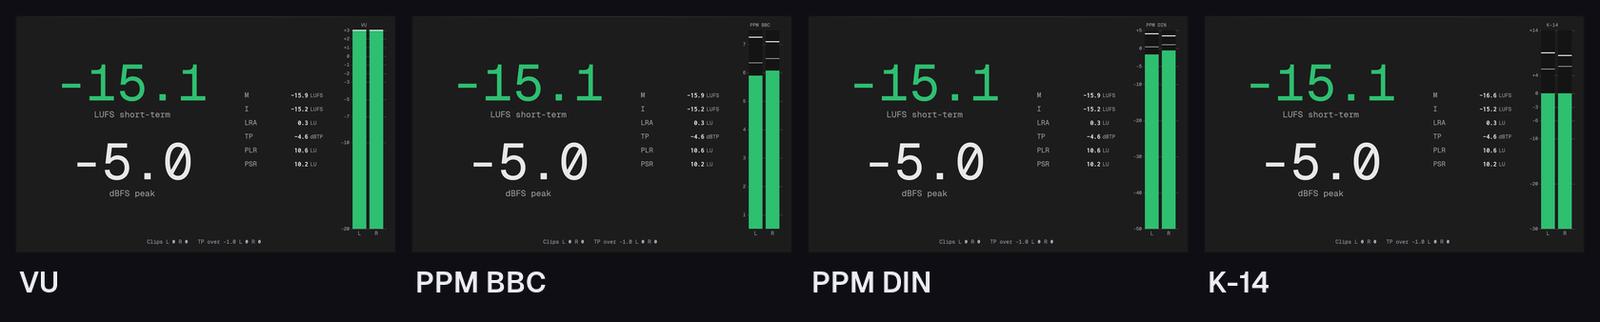
Along the bottom, the counters show per channel how many times the audio clipped (Clips: samples at or over 0 dBFS) and how many times its true peak went over a ceiling (TP over, −1 dBTP by default: what streaming services ask for). A run counts once, however long it lasts; a count turns red once it's above 0. Count clips and overs turns them off, and True-peak ceiling sets the ceiling (−6 to 0 dBTP).
See Measurements for exactly what each number is.
Stereometer
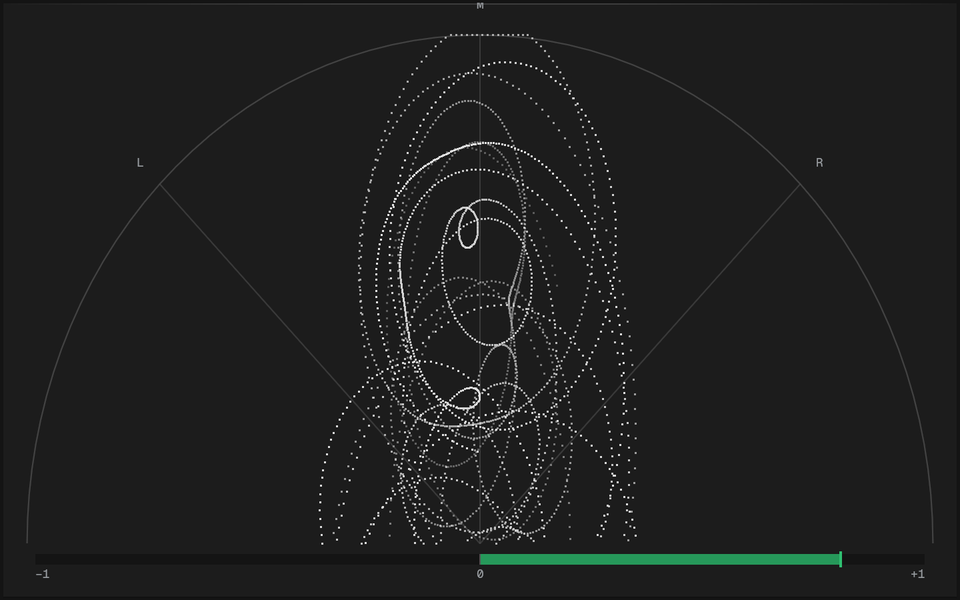
Where the sound sits between left and right, with the phase correlation under it (+1: mono, 0: unrelated, −1: out of phase) and an optional Balance bar. Settings: the view, Scale (auto or fixed gain), persistence and the correlation's averaging time. The scope stretches to whatever shape the Meter has; in a wide, low Meter the bars stand upright beside it.
Goniometer
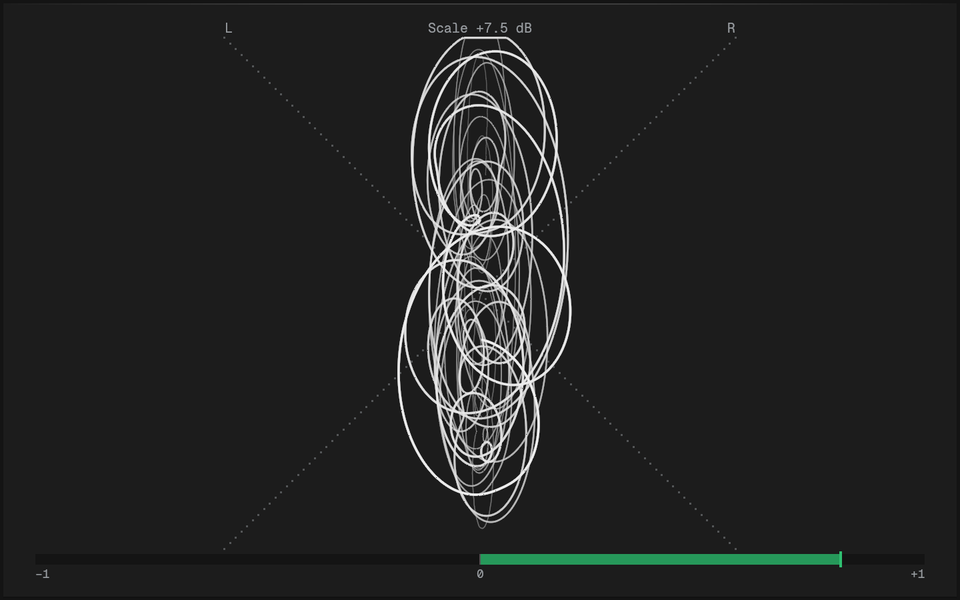
The stereo image as on the old studio meters: Left against Right as a cloud of glowing points, in a square with the L and R axes dotted across it. Mono stands upright in the middle, wide stereo spreads out sideways, and something out of phase lies flat. Where many points land the cloud burns towards white, so the densest part of the image glows hottest. A quiet signal is scaled up to fill the square, and Scale at the top says by how much (Scale in the settings: auto or a fixed gain). Below it, the phase correlation (+1 mono, −1 out of phase). Settings: Persistence (how long a point glows), Correlation bar and the correlation's averaging time. It uses the Stereometer's colours.
Cepstrum
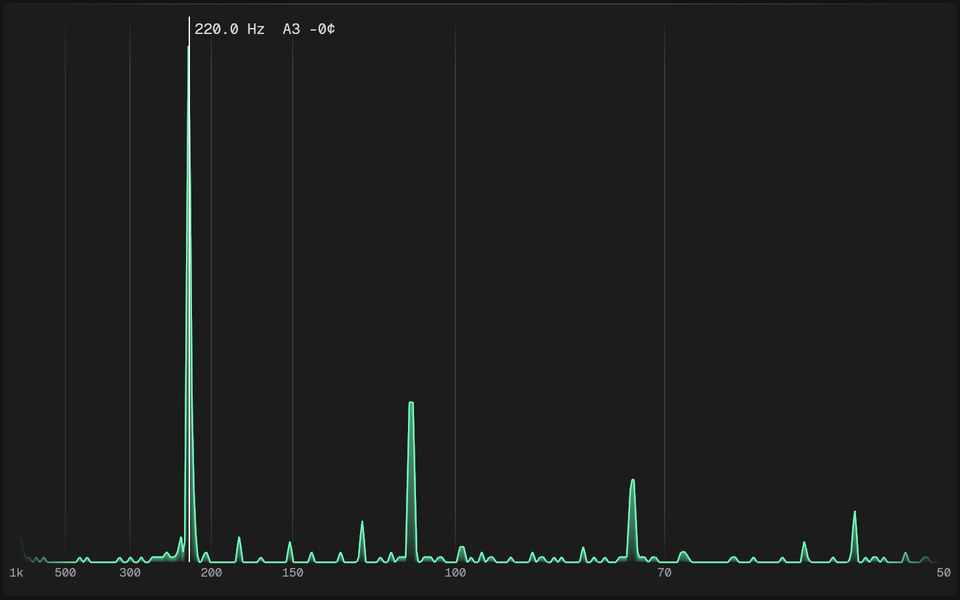
The cepstrum of the mono sum: evenly spaced partials of a harmonic sound (a voice, a bass, most instruments) make a peak at the length of their period, and echoes make peaks at their delay. The axis runs from short periods (high pitch) on the left to long ones (low pitch) on the right, labelled in Hz. With Show pitch on, a line marks the pitch found, with its frequency and note; noise and chords give "No pitch". Under the mouse it shows the pitch and note of the period there. Settings: FFT size, the lowest and highest pitch to look for (50 to 1000 Hz by default) and the smoothing.
To show it, right-click a Meter and choose Change Meter ▸ Cepstrum, or Add Meter ▸ Cepstrum.
Spectrogram
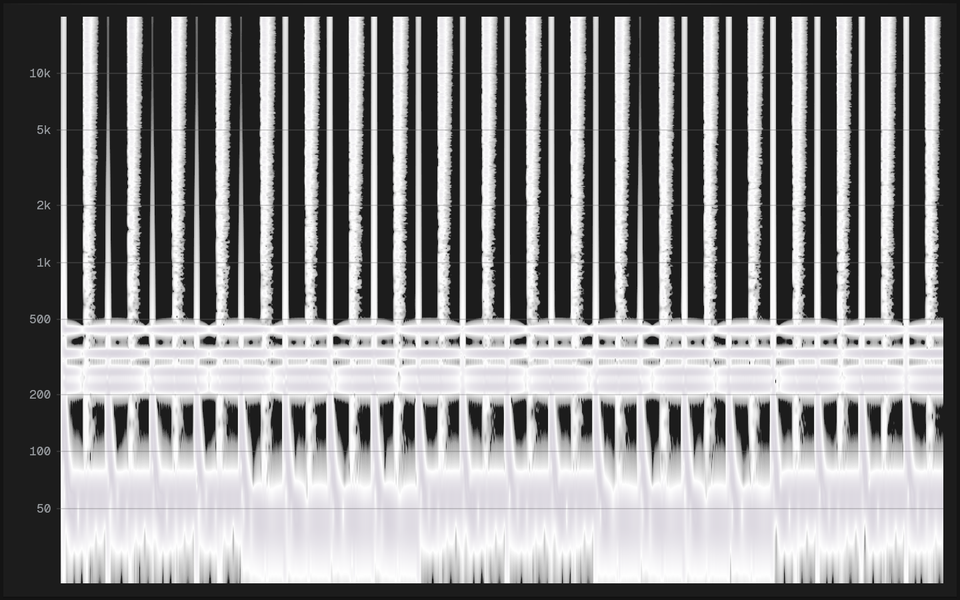
The Spectrum over time: frequency from the bottom up, time scrolling to the left with the newest audio at the right edge, and louder shown brighter, in the Theme's Spectrum colours up to its text colour. Settings: Span (5, 10, 20 or 30 s), Frequency scale, and in the settings panel the FFT size, window, slope and the frequency and level ranges. Drag a box over it to zoom into the box's frequencies: a zoom window opens in the other half of the Meter at the finest frequency resolution, scrolling three times slower so the detail shows. Its × closes it.
To show it, right-click a Meter and choose Change Meter ▸ Spectrogram, or Add Meter ▸ Spectrogram.
Phase Scope
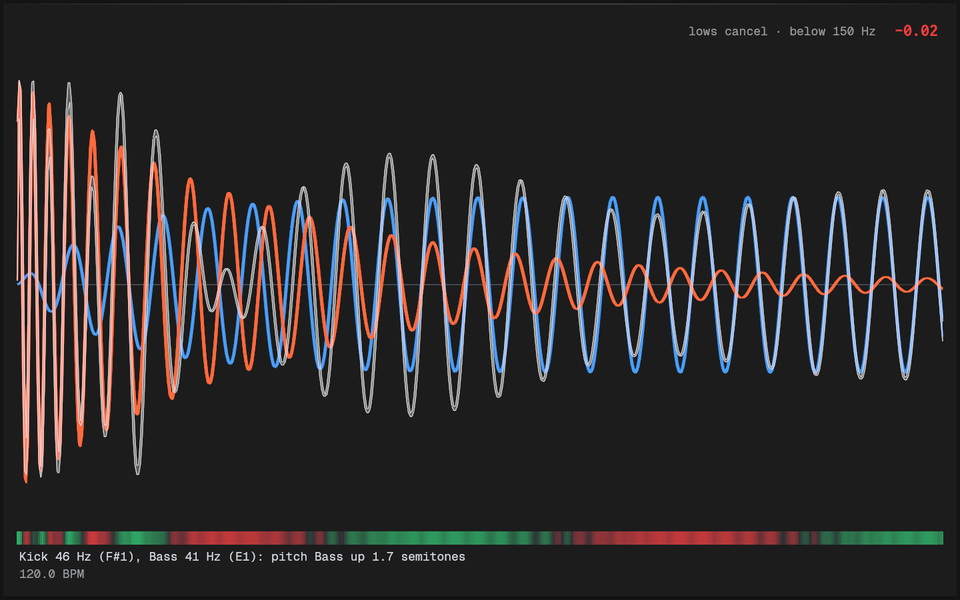
The waveform over one Cycle, one beat or one bar, held still so every beat lands in the same place: a kick on the beat stays put, and you can watch how its attack and tail sit against the bass. The newest Cycle is drawn sharp with the few before it fading behind. It's drawn as it plays, column by column, so a fade-out fades smoothly.
On a Send Plugin it follows the DAW: its tempo, its beat and, for a bar Cycle, its time signature. When the DAW stops, it keeps running at the last tempo and locks on again when you press play. On System Capture there's no DAW to follow, so it runs at a Tempo you type in (120 BPM by default), as it does for a Send Plugin from an older version or a host that doesn't say its tempo ("No tempo from …"). The tempo it follows is shown at the bottom left. All its options are in its right-click menu:
- Cycle: one beat, or one bar with a line on each beat. A bar follows the DAW's time signature, or is 4/4 when there's no DAW to say.
- Tempo, with a Tap button: tap along twice or more and the taps set it. A pause of two seconds starts a fresh count.
- Look: a line, or filled to the centre.
- Channels: mono, Left and Right, or Mid and Side, each in its own band.
- Gain: auto (the loudest point fills the Meter) or manual, in dB.
- Steadiness: the newest Cycle sharp with the previous few fading behind it, or the last few Cycles averaged, which holds a repeating pattern steady and smooths out a one-off.
Overlay Source
While listening to Send Plugins, pick an Overlay Source in the Phase Scope's menu: a second Send Plugin from the same DAW, say the bass track under a Phase Scope on the kick. It's drawn over the main trace in its own Send Plugin's colour, placed by its own song position, so the two line up as they do in the song, with their sum (what's actually left) drawn as its own waveform on top (Show sum, on by default), or in its own row under the two with Sum in its own row. A coloured lane under the Cycle shows how their lows move at each point: green where they push together, red where they cancel, stronger where they're louder. The number in the row above the waves is their Cycle correlation below the Cycle correlation below frequency (150 Hz by default), with what it means in words: +1 when the lows move together, −1 when one is the other upside down. It's measured over the last whole Cycle, about each track's own average, so it isn't the Stereometer's correlation (see Measurements). It's blank in silence, and the first thing left out when the Meter is small. Offset nudges it a few milliseconds later (+) or earlier (−). Turn on Suggestions and, when the lows don't fit, it says what would help under the lane: flip the Overlay Source's polarity, move it by so many milliseconds (set that as the Offset to hear it), or pitch it to match the other's low end. Once they fit it says so in green (Lows fit, with the number), and if nothing simple would help it says that too, so a change always gets an answer. If its Send Plugin goes away, the Phase Scope says "Waiting for …" until it's back. The pick and offset are saved in Presets. With System Capture there's only the one Source, so the option is greyed out. An Overlay Source is compared in mono, so while one is shown the main trace is mono too.
Text never sits on the traces. When it's small the suggestions go first, then the words beside the number, then the number, so the traces keep the room.
To show it, right-click a Meter and choose Change Meter ▸ Phase Scope, or Add Meter ▸ Phase Scope.
Oscilloscope
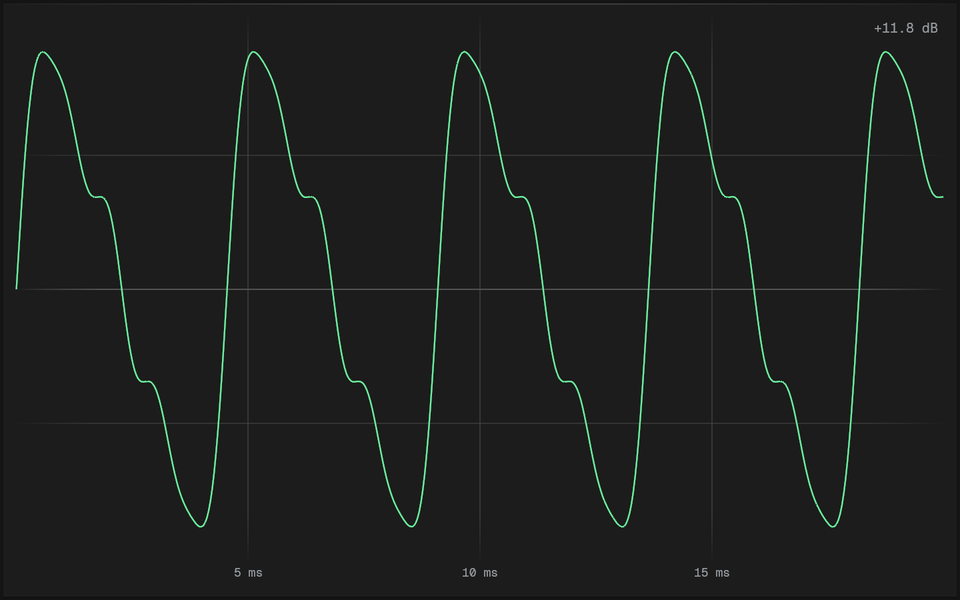
The wave itself, across a short window of time (20 ms by default, anything from 1 to 200 ms). With Hold still on, each picture starts on a rising zero crossing, so a steady tone stands still instead of rolling past; when nothing repeats (noise, silence) it runs free and the corner says "Free". With it off, it always shows the newest audio.
Channels shows the mono sum, or Left and Right (or Mid and Side) drawn over each other, the second in its own colour. Auto gain raises quiet audio to fill the height, by up to +48 dB, and shows how much in the corner: it drops at once when the audio gets louder and rises over about half a second when it gets quieter, and holds still in silence.
Lines across mark the centre and half height; the time divisions are labelled in milliseconds.
To show it, right-click a Meter and choose Change Meter ▸ Oscilloscope, or Add Meter ▸ Oscilloscope.
Needle Meter
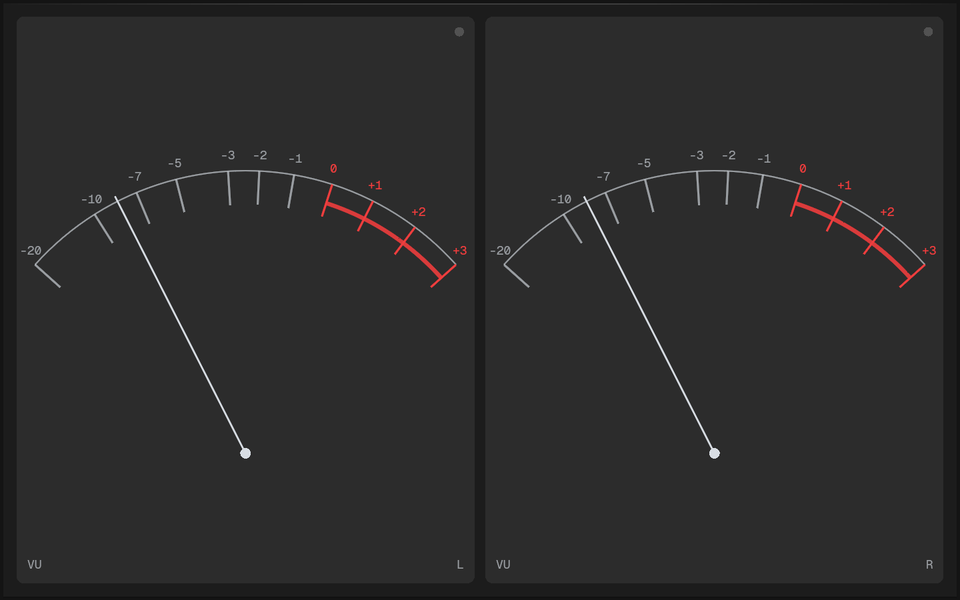
A classic needle per channel, Left and Right side by side (or one over the other, whichever gives bigger dials), or one needle on the mono sum. Scale picks VU (0 VU at −18 dBFS by default, adjustable) or a PPM (DIN, Nordic, BBC, EBU), each with the timing and numbers of the Loudness Meter's Scales (see Measurements). A VU's dial is spaced as real ones are, by voltage, so 0 VU sits about two thirds across; a PPM's is spaced by dB. The red zone starts at 0 VU, or at a PPM's permitted maximum (−9 dBFS). The lamp in the corner lights when a needle reaches the end of its scale and stays lit for a second. It fits the Bar.
To show it, right-click a Meter and choose Change Meter ▸ Needle Meter, or Add Meter ▸ Needle Meter.
Stereo Bands
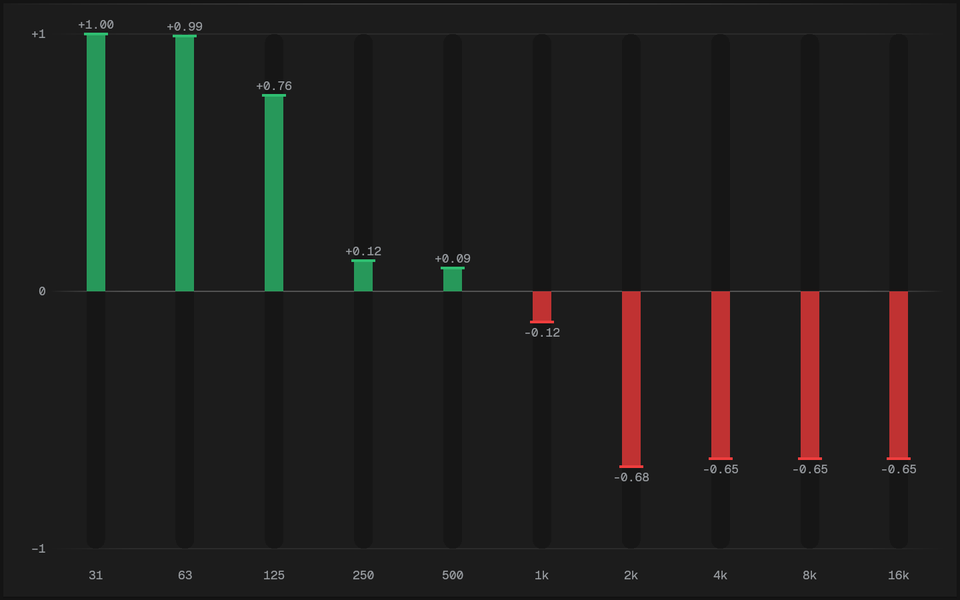
How alike Left and Right are in each of ten octave bands, from 31 Hz to 16 kHz: is the low end mono, and where is the width? Each band's band correlation is drawn as the Stereometer draws its Correlation: a bar from −1 (opposite polarity) to +1 (alike), filled from 0 with a marker at the reading, in the Correlation colours. It's the Stereometer's Correlation measured on that band alone, named apart so the two aren't confused. A silent band is left empty. Averaging sets how calmly the readings move (300 ms by default).
A common aim for electronic music: band correlation near +1 below about 120 Hz, so the low end stays punchy and survives mono playback. Tonal Balance's Low mono reading is the same maths below its cutoff.
To show it, right-click a Meter and choose Change Meter ▸ Stereo Bands, or Add Meter ▸ Stereo Bands.
Tuner
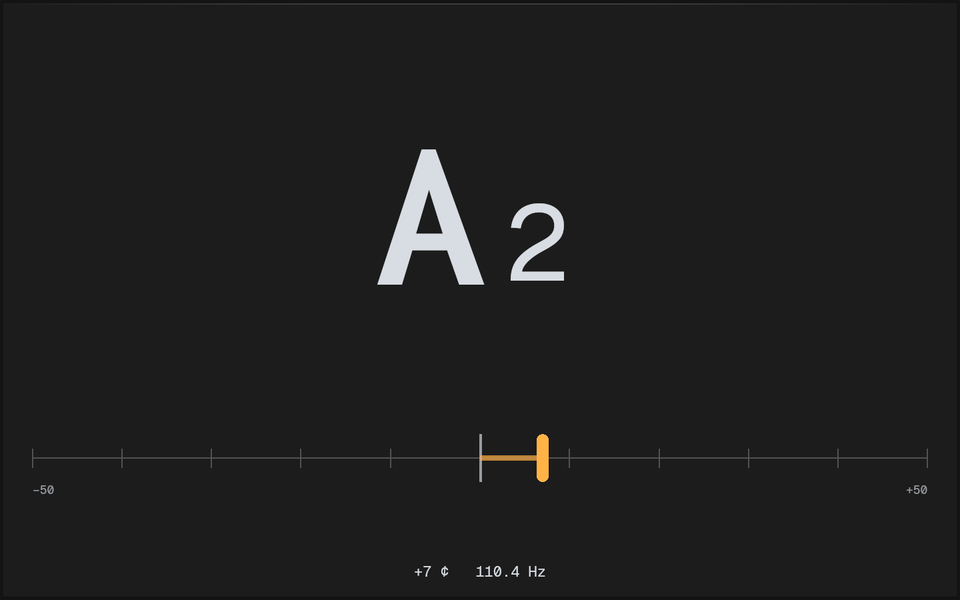
The note being played, large, with a bar of cents from −50 to +50 under it and the pitch in Hz: tune a bass, a kick's pitch or a synth. Within 5 cents of the note it turns the Tuner in tune colour. It finds the pitch as the Cepstrum does, then refines it from the sound's harmonics to about a cent, and steadies it while a note holds; a new note shows at once. When the pitch is lost it keeps the last reading for a second, faded.
A4 sets the reference pitch (415 to 466 Hz, 440 by default). Its advanced settings are the Cepstrum's: the FFT size (8192 by default, for low notes) and the lowest and highest pitch looked for (30 Hz to 1 kHz). Short and wide, as in the Bar, the note sits beside the bar.
To show it, right-click a Meter and choose Change Meter ▸ Tuner, or Add Meter ▸ Tuner.
Tonal Balance
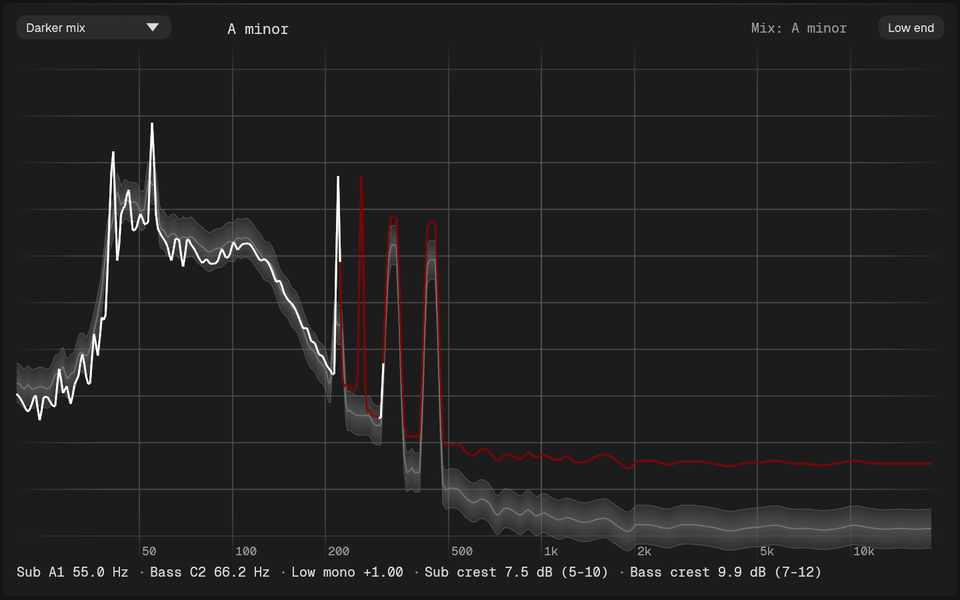
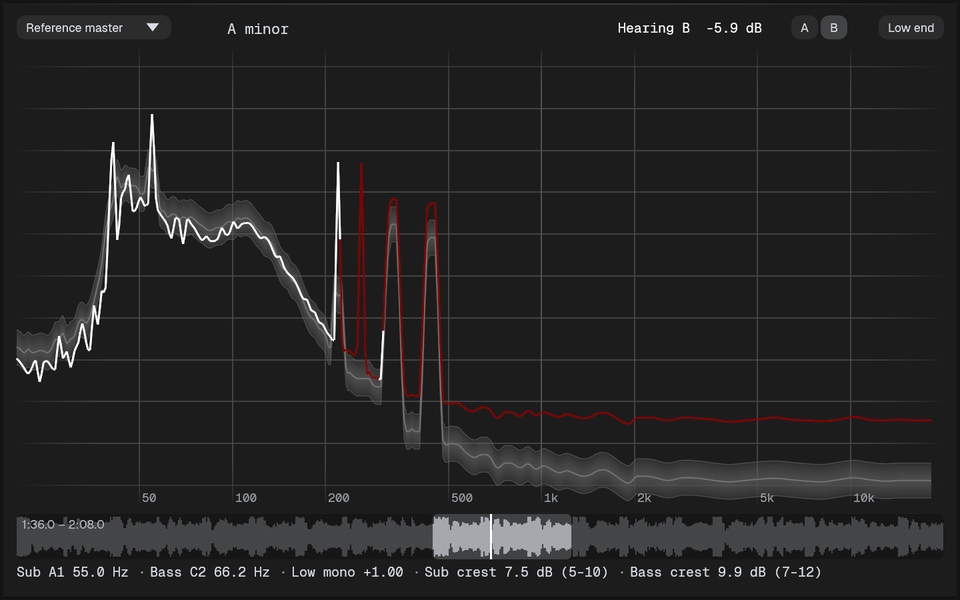
Compares the shape of your mix's spectrum with a Target: a reference made from songs you choose. Both are measured over a long stretch and set to their own loudness, so only the balance counts, not how loud each is. The mix's line is drawn over the Target's range: in its own colour where it's inside, too much or too little colours where it's outside, judged over about a third of an octave, as the ear hears balance.
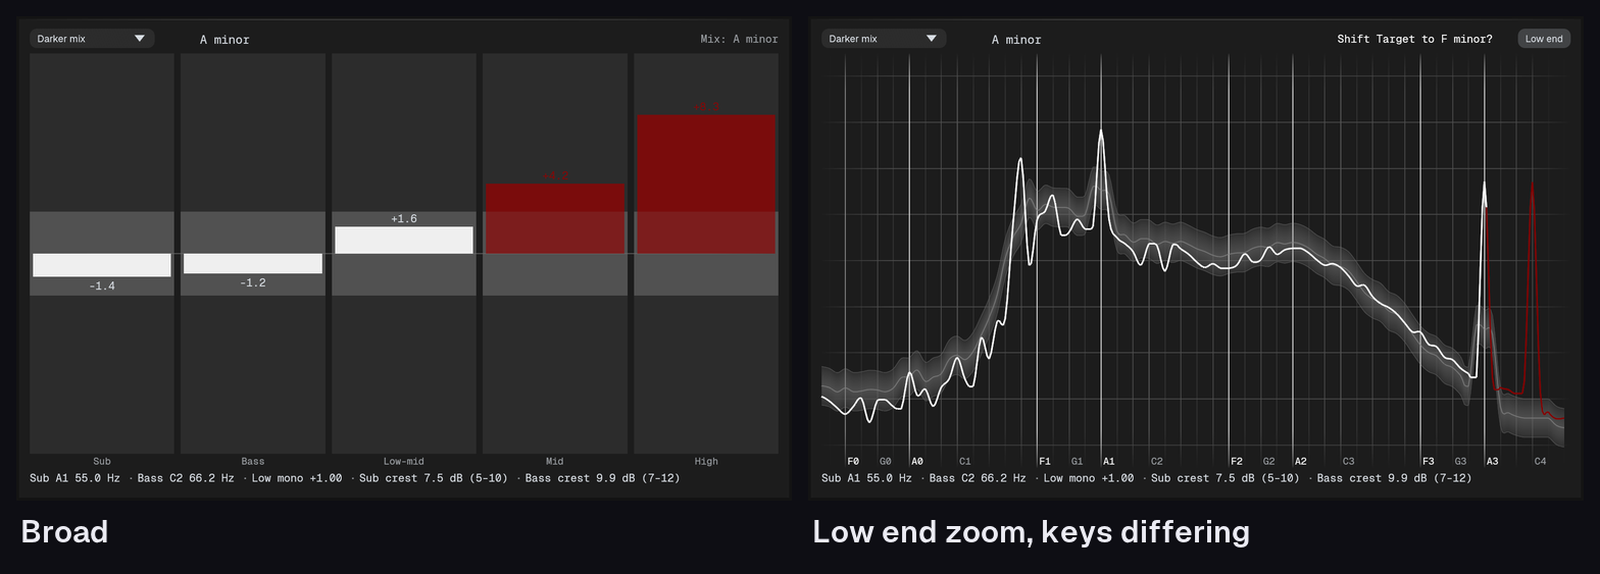
- Fine draws the curves from 20 Hz to 20 kHz, finest in the low end: 1/24 octave (two points per semitone) up to 300 Hz, coarser above.
- Broad draws five regions, Sub (20–60 Hz), Bass (60–120), Low-mid (120–300), Mid (300 Hz–2 kHz) and High, each a bar showing how far the mix is from the Target, inside its range or not.
- Auto (the default) shows Fine in a window and Broad in the Bar.
- Low end zoom (the Low end button on the Meter) shows only 20–300 Hz, with a grid line on every note and the keys' root notes marked, so a bass that's too much on one note shows.
The view keeps its level range steady as the music moves: it widens at once when the curves would leave it, and narrows, smoothly, only when there's plenty of room. Point at the curves to see the frequency and note there, and how far the mix sits from the Target at that point.
Under the curves, the low end's figures: the loudest Sub and Bass notes ("Sub A1 55.0 Hz"), Low mono (how alike Left and Right are below 120 Hz, from +1, mono, down; under +0.8 it's marked, as a wide low end loses punch and can cancel on mono systems), and the crest of the Sub and Bass (peak over average, in dB: how punchy they are) against the Target's.
Average sets how far back the mix's curve reaches: 3 s, 10 s (the default), 30 s or Whole (everything since Reset average). Freeze keeps the curve as it is now as a ghost, to compare before and after a change. Add files… ▸ A bounce of your mix, to compare… compares a bounce of your mix instead of the live Source; Stop comparing goes back.
Listening A/B
When the song you compare with came from a file, A and B appear on the Meter: A is your mix, B plays the song, turned up or down to your mix's loudness so the louder one doesn't sound better just for being louder. The song keeps running while you hear A, so switching back picks up where it is; it loops at its end. While B plays, the mix's average pauses.
A Spectrum can show B too: with a song loaded for A/B, Show B in the Spectrum's menu draws B's spectrum as a grey layer, gain-matched to your mix, while you hear either. Compare the two traces as you switch.
Under the curves, the song's waveform shows where B is. Drag across it to choose the part B plays, say the drop, and it loops just that part; click to play from a point to the end, double-click for the whole song again.
While B plays you hear the song alone:
- On Send Plugins, the Das-Meter Send the Meter listens to goes quiet (it fades out and back in).
- On System Capture, everything else on the computer goes quiet, your DAW too; only Das-Meter plays. The Meters still see the mix (on macOS), so switching back is instant. Switch to A and it all plays again, as it does if Das-Meter quits. On macOS this uses the same permission as System Capture; on Windows each other app's sound is muted and unmuted after (an app you'd muted yourself stays muted). On Linux it can't yet, so put a Das-Meter Send on your DAW's master bus, or stop playback, to hear the song alone.
Targets
Make a Target from songs that sound the way you want, your own references. Songs are shown by their file's name (or the name you gave a learned one). The Meter compares with one of them, picked at the top left of the Meter (the song you just added, at first); Average of all compares with all of them together instead.
- Learn a song…, play a song from start to end, give it a name (or leave it as "Song 1"), then Add.
- Add files… ▸ Reference songs for the Target… analyses audio files (WAV, AIFF, FLAC, MP3, Ogg, AAC/M4A, ALAC) in the background, far faster than playing them. You can also drop files or whole folders on the Meter. Files that can't be read are listed with the reason.
By default only each song's loud parts count (its drops and choruses, within 4 LU of its loudest moments); Teach with ▸ Whole song counts all of it. Averaged, the Target's range is how far its songs differ from each other; one song's is ±2.5 dB. Songs lists them, and × removes one.
Each song's key is detected, and its low end is lined up by key before the songs are averaged, so the Target stays note-sharp. When your mix is in another key ("Your mix is in F minor, this Target's songs in A minor"), Shift moves the Target's low end (below 300 Hz) to your key, and it stays there, whatever the key detection says next, until Undo shift. The suggestion only comes once the detection has named the same key for 10 seconds, and then stays. Mix key can also be set by hand instead of detected.
Targets are files in the targets folder (next to curves and themes),
one per Target, holding each song's figures and where its file is (for
A/B), never any audio. An exported Preset takes its Targets along, without
where the files are. Das-Meter ships no Targets: make
your own from music you know.
To show it, right-click a Meter and choose Change Meter ▸ Tonal Balance, or Add Meter ▸ Tonal Balance.
Small sizes
When a Meter gets small, it shows less (fewer labels and readings) rather than letting them overlap.
Layout
Das-Meter has two layouts; switch in the Window menu (macOS) or the settings.
Bar
A strip of Meters docked to a screen edge. Drag its inner edge to change its thickness, drag between Meters to share out the space, and drag its ends to make it shorter. Choose the edge in the settings (Bar ▸ Edge). Hold ⌘ (Ctrl on Windows) and drag the Bar to put it anywhere on the screen; it keeps its size, can still be resized there, and stops reserving space. Picking an edge docks it again.
The Bar holds as many Meters as you like, of any kind. Add Meter in a Meter's right-click menu puts a new one next to it, sharing its space, on the side you right-clicked: the menu names that side (Add Meter on the left). Change Meter swaps the Meter you right-clicked for another kind, and Remove from Bar takes one out.
- Float on Top (Window ▸ Float on Top) keeps it above other windows.
- Reserve space (Windows) makes other windows make room for the Bar. macOS has no such thing, so there the Bar floats.
Pop-outs
Take a single Meter out of the Bar into its own window with Pop out in its right-click menu; Dock back (or closing the window) returns it.
Window mode
All Meters in one ordinary window, split into panes. Drag the dividers to resize panes; Add Meter, Change Meter, Split side by side, Split stacked and Remove Meter are in a Meter's right-click menu. Add Meter splits the pane you right-clicked on the side nearest the pointer: right-click the upper part of a Meter and the new one goes above it, near its right edge and it goes to the right. Always on top is in the settings.
Fullscreen apps
Show over fullscreen apps (in the Bar settings) keeps the Bar visible over other apps' fullscreen windows. On macOS this hides Das-Meter's Dock icon while it's on; the menu bar icon stays.
Virtual desktops
On macOS, the Bar stays on its Space, like other windows; with Show over fullscreen apps on, it's on every Space. On Windows, the Bar stays on its desktop; to have it on every desktop, right-click it in Task View and choose Show this window on all desktops. Das-Meter tells you this once, the first time you switch to a desktop without it.
Multiple displays
Each window (the Bar, each Pop-out, the Window) remembers the display it's on. If that display is disconnected, the window moves to the main display; it goes back when the display returns, unless you moved it in the meantime. To keep the new place, use Window ▸ Keep Windows Here.
Themes
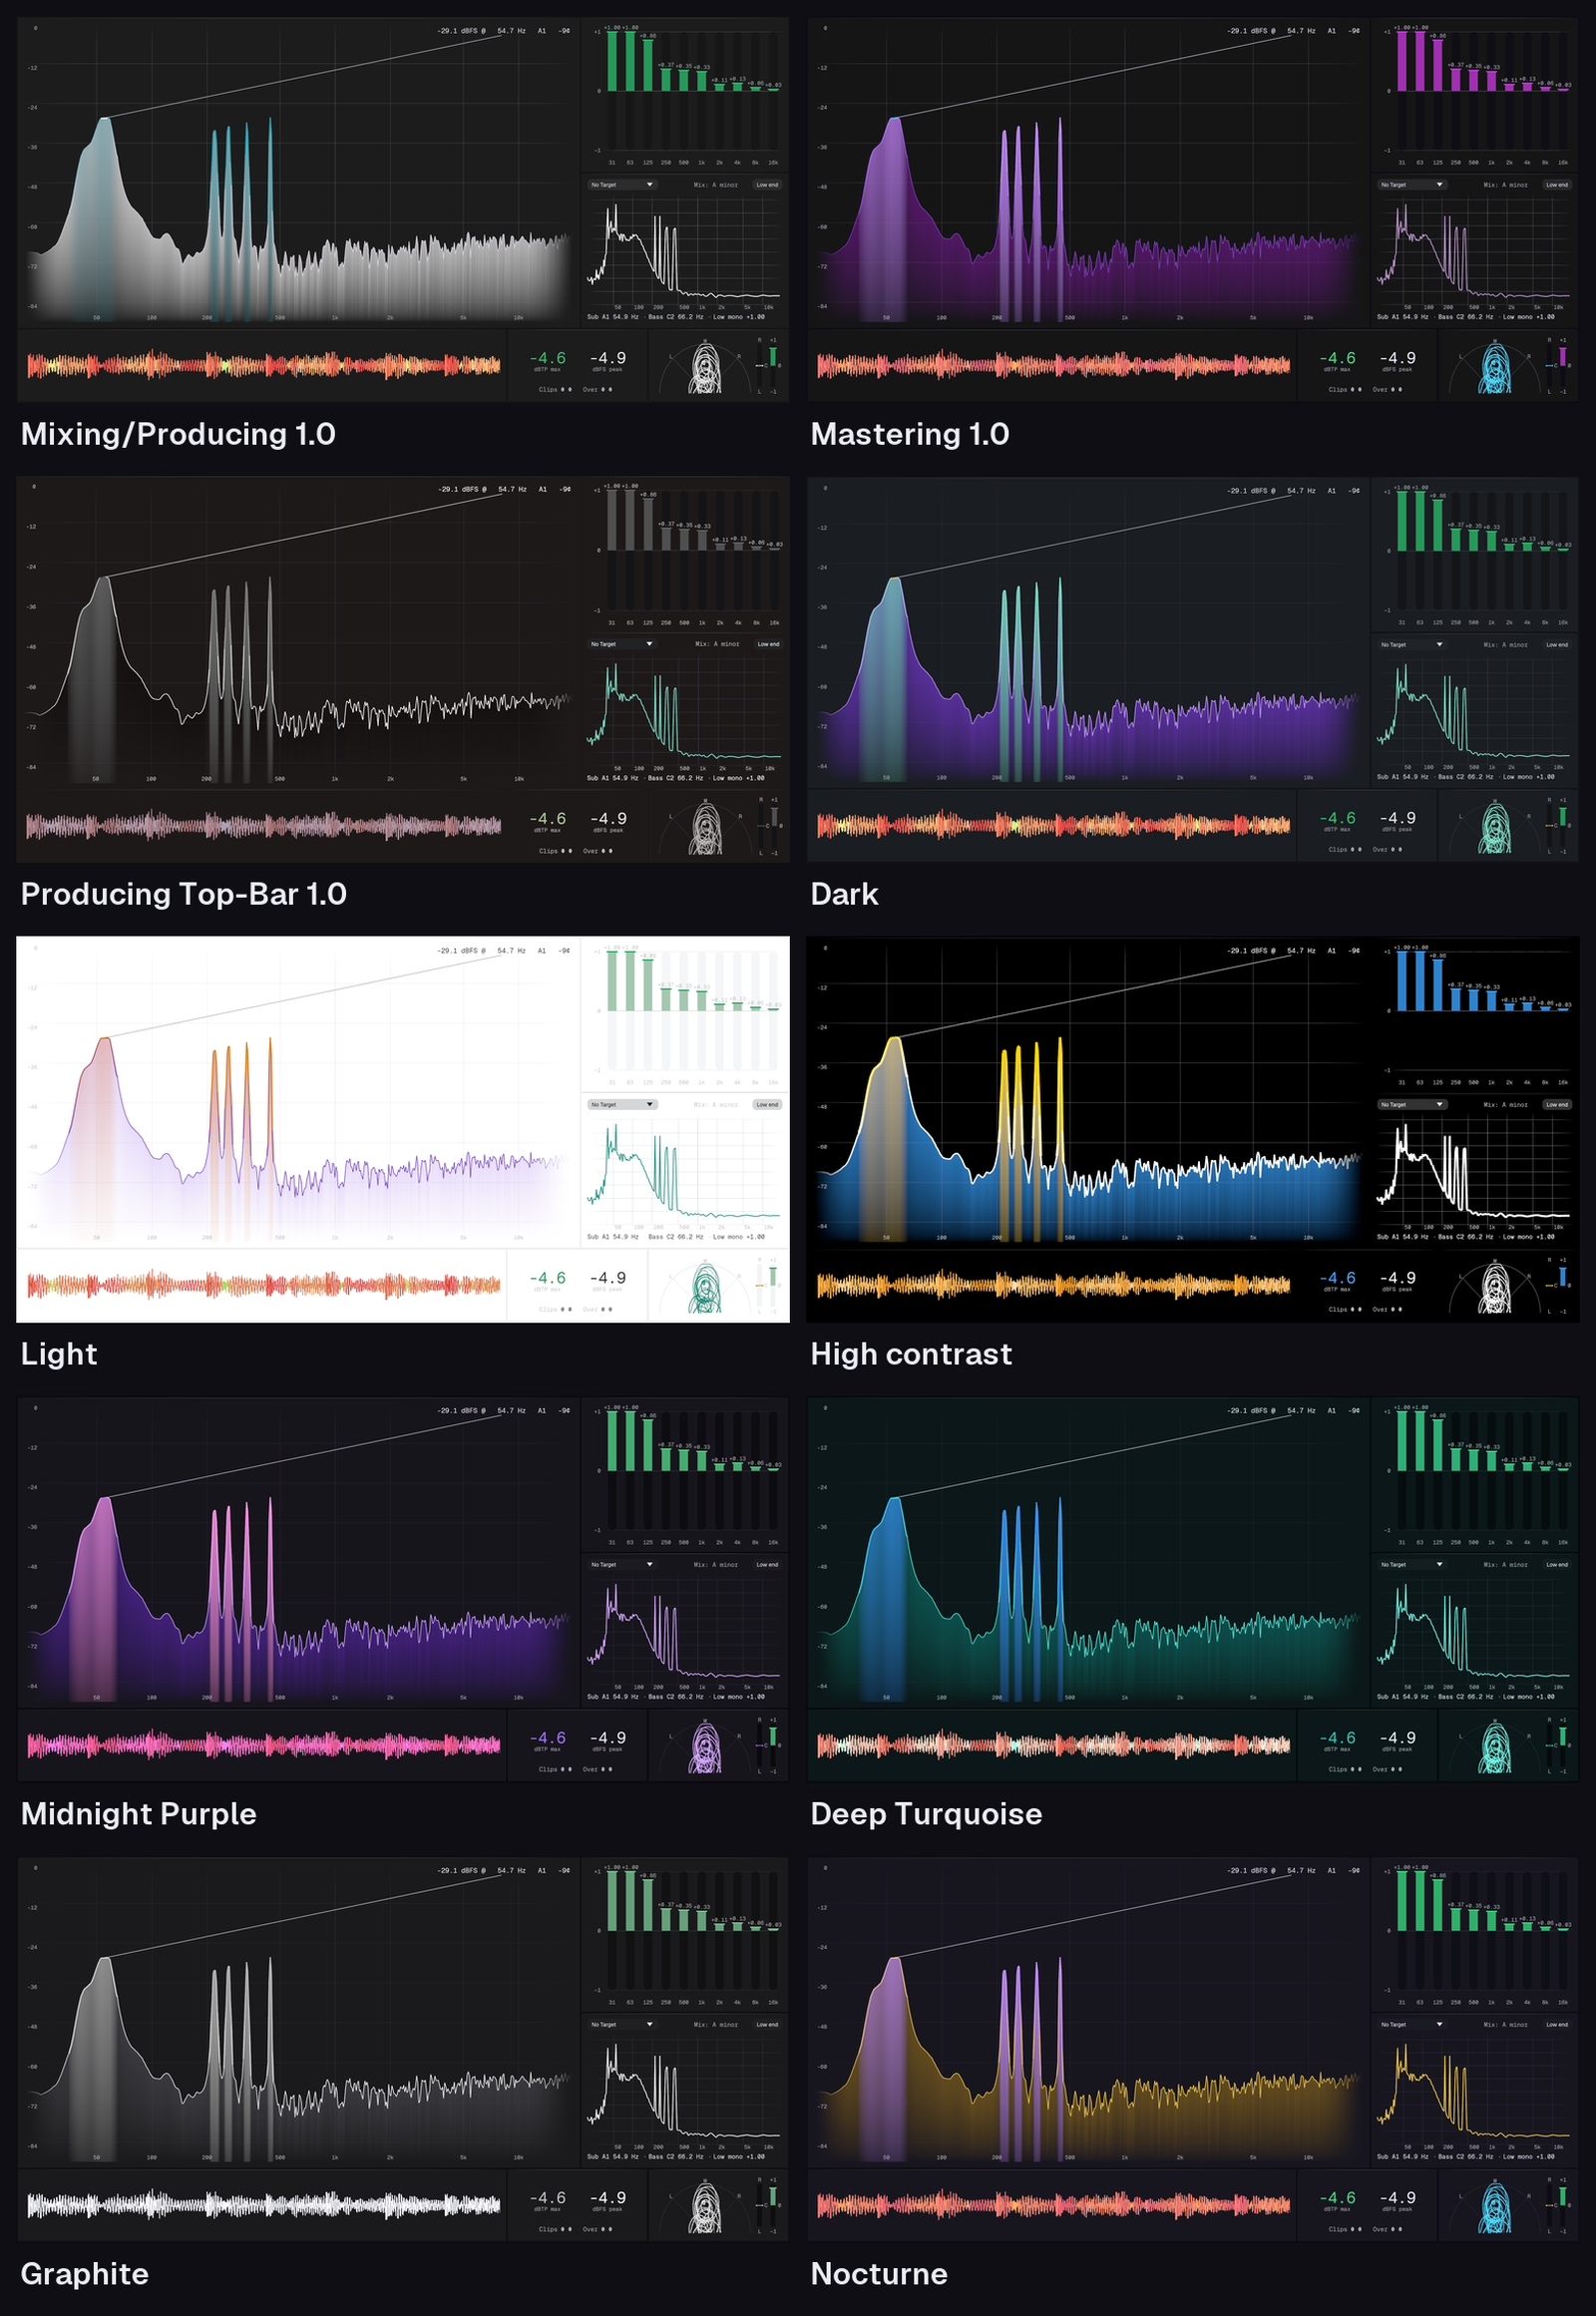
A Theme is a named set of colours and styling: background opacity, line thickness, spacing, corner radius, text size and its Look. Das-Meter comes with the built-in Presets' Themes (Mixing/Producing 1.0, the standard one, Mastering 1.0 and Producing Top-Bar 1.0), Nocturne (deep blue-violet black with gold, cyan and green), Dark, Light and High contrast (a colour-blind-safe palette, with shape cues besides colour), and three darker ones with a near-black body and dark grey panels: Midnight Purple, Deep Turquoise and Graphite (neutral greys with light grey and white).
By default a Preset uses the Mixing/Producing 1.0 Theme and Light as a pair and follows the system's light/dark setting. Turn that off to pick one Theme. Every built-in starts from the same styling: the Smooth Look without glow, gradient or vignette, thin lines, a light grid fade, a 2.3 px gap and square corners.
Edit ▸ Undo (⌘Z, Ctrl+Z on Windows) takes back the last change to a Theme or Preset, such as a Theme picked, a colour or a slider; Redo (⇧⌘Z) makes it again. A slider dragged counts as one step.
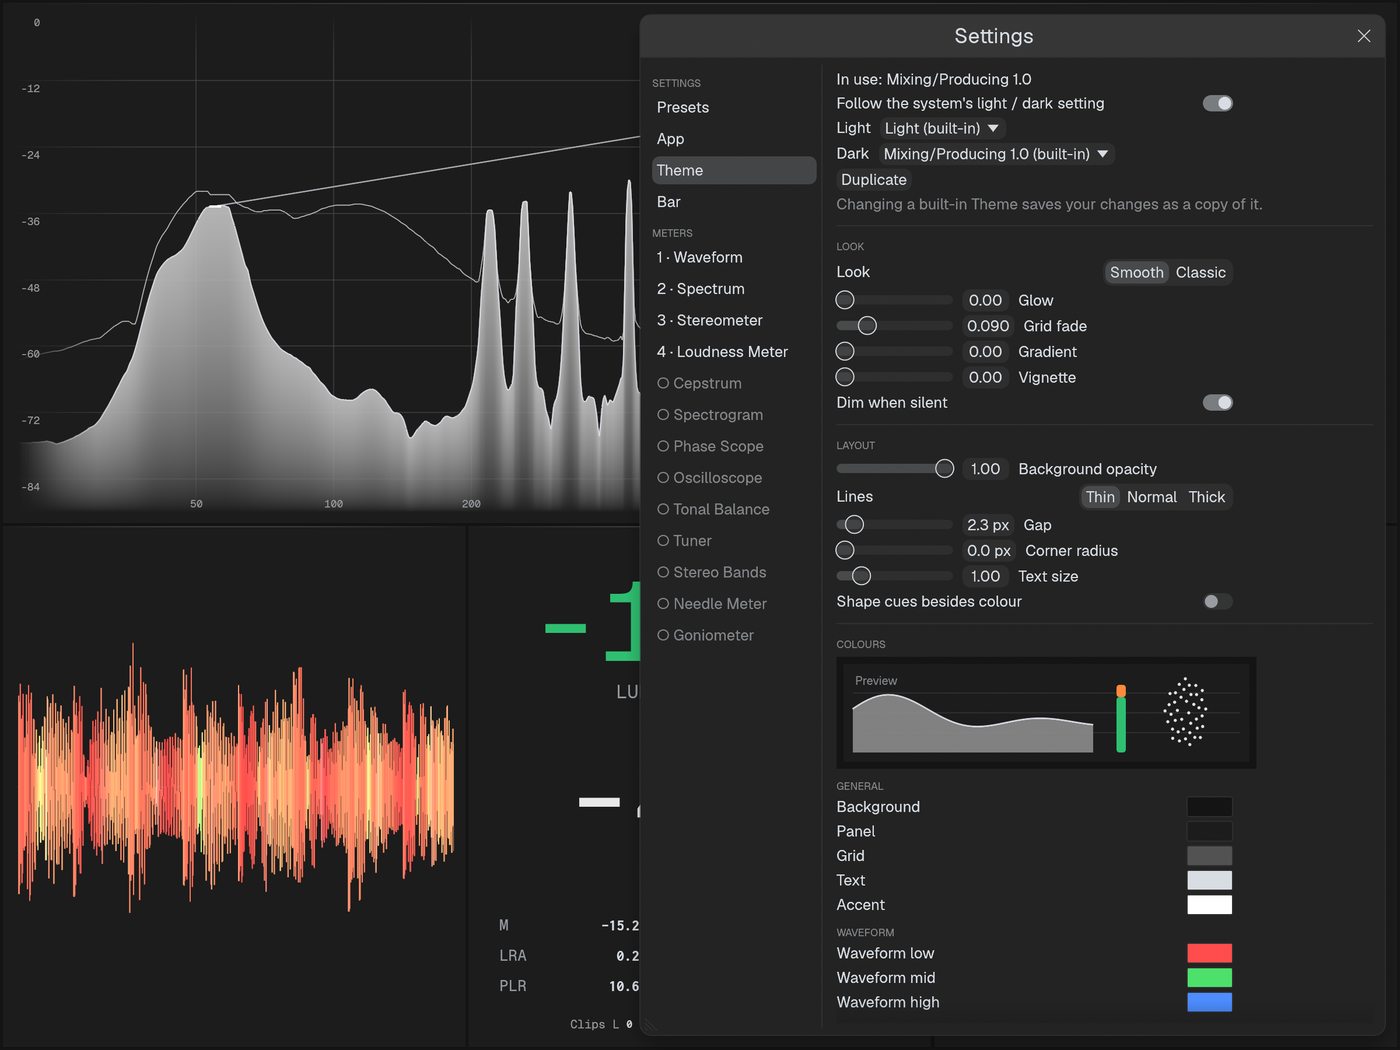
To make your own, change any colour or slider of a Theme in the settings.
Changing a built-in Theme saves your changes as "
- macOS:
~/Library/Application Support/Das-Meter/themes - Windows:
%APPDATA%\Das-Meter\themes - Linux:
~/.config/das-meter/themes
A lower background opacity makes the Meters see-through.
Look
Each Theme is drawn in one of two Looks:
- Smooth (the default): floating rounded panels on a soft gradient with a faint vignette, thin grids that fade out toward the edges, a soft glow under the traces, fills that fade to transparent, and a glow behind the big Loudness numbers. Reference lines (0 dB, the loudness target, 1 kHz, the Phase Scope's centre line) stand out a little from the rest of the grid. Hovering a Meter brightens its grid, and a Meter dims gently after about a second of silence. On light Themes, glows become soft shadows.
- Classic: the flat look of earlier versions.
With Smooth you can tune Glow, Grid fade, Gradient, Vignette and Corner radius, and turn Dim when silent off.
Presets and sharing
A Preset is a saved setup: which Meters you see, how they're arranged, their settings and their Theme. Changes save on their own a moment after you make them; Revert Preset goes back to how the Preset was when you opened it.
-
Switch Presets from the Presets menu, or with ⌘1–⌘9 (Ctrl on Windows) for the first nine.
-
Save as New Preset keeps the current setup under a new name.
-
The built-in Presets can be reset to how they came. Each comes with its own Theme, of the same name:
- Producing Top-Bar 1.0: a Bar along the top edge with Waveform, Spectrogram, Stereometer and a Mid/Side Spectrum.
- Mixing/Producing 1.0: Spectrum and Stereo Bands on top; Waveform, Loudness Meter and Stereometer below.
- Mastering 1.0: Spectrum over Tonal Balance; Stereo Bands, Waveform, Loudness Meter and Stereometer below.
An update that brings new built-ins adds them once, at the end of the list. Copies of an earlier version's built-ins stay in the list as your own Presets.
Presets are files in the presets folder:
- macOS:
~/Library/Application Support/Das-Meter/presets - Windows:
%APPDATA%\Das-Meter\presets - Linux:
~/.config/das-meter/presets
Sharing
Export Preset… saves the current Preset as one .dasmeter-preset file,
with its Theme inside. Send it to someone; they open it with Import
Preset…, by dropping it on Das-Meter or, on macOS, by double-clicking it.
A shared Preset leaves out what's personal to your setup, such as which monitor serial number a window was on.
Updates and uninstall
Updates
Das-Meter looks for a new version once a day (turn this off in the settings with Check for updates daily). When there's one, a quiet note says so.
macOS: Das-Meter ▸ Check for Updates… looks now, and Das-Meter ▸
Update to Das-Meter version… installs it. Before installing, Das-Meter
checks that the download is signed with the release key built into the app,
and that the new app is signed with Das-Meter's certificate. It then replaces
itself and restarts. If Das-Meter can't write to its folder (for example
/Applications on an account without admin rights), it opens the release page
so you can update by hand. The Send Plugin is updated with the app; restart
your DAW when Das-Meter says so.
Windows: in the settings, App has Check Now and, when there's a new version, Update to Das-Meter version…. Das-Meter downloads the installer, checks it's signed with the release key built into the app, and closes; Windows asks to allow the installer, which updates Das-Meter and the Send Plugin and starts Das-Meter again. If a DAW has the Send Plugin open, the new one takes its place when you next restart Windows. If you don't allow the installer, Das-Meter starts again unchanged.
Your Presets, Themes and settings stay either way.
Uninstall
macOS: choose Das-Meter ▸ Uninstall Das-Meter…. It moves the app and the Send Plugins it installed to the Trash. Your Presets, Themes and settings stay, unless you choose Uninstall and Delete My Presets and Themes.
Windows: use Settings ▸ Apps ▸ Installed apps ▸ Das-Meter ▸ Uninstall. It removes the app and the Send Plugin. Your Presets, Themes and settings stay, unless you answer Yes to Also delete my Presets and Themes?
Measurements
Das-Meter claims its numbers, not a display standard. The Loudness Meter measures to ITU-R BS.1770-5 and EBU Tech 3341/3342 (momentary, short-term and integrated LUFS, LRA, true peak), tested on those standards' cases (see How it's checked). It does not claim "EBU Mode", because that also requires the EBU +9/+18 display scales, which Das-Meter doesn't have yet.
These definitions are fixed, because you compare readings across meters, and changing them later would silently move everyone's numbers.
Definitions
- LUFS, LRA, true peak: the
ebur128crate, pinned to an exact version. True peak oversamples 4× below 96 kHz and 2× at 96 kHz. - Sample peak:
20·log10(max|x|)per channel. - Scales (the bars' VU, PPM and K-System ballistics): defined in ADR 0007. VU reaches 99% in 300 ms with 1.25% overshoot; PPM Type I (DIN, Nordic) reads 80% of a 5 ms burst and falls 20 dB in 1.7 s, Type II (BBC, EBU) 80% of a 10 ms burst and 24 dB in 2.8 s; alignment and 0 VU are a sine peaking at −18 dBFS.
- Counters: per channel, since the last reset. Clips: runs of samples
with
|x| ≥ 1.0(0 dBFS), each run counted once. TP over: runs of true peak above the ceiling (−1 dBTP by default), looked at in 10 ms blocks, so overs less than 10 ms apart count once. - RMS: AES17 by default (+3.01 dB, so a 0 dBFS sine reads 0 dB), labelled "RMS (AES17)"; plain RMS is an option. A sliding rectangular window, 300 ms by default.
- Correlation: Pearson
Σ(L·R)/√(Σ(L²)·Σ(R²)), no DC removal, the sums averaged exponentially with τ = 300 ms. With both channels below −90 dBFS it reads 0 and dims as "no signal"; with only one channel carrying signal it reads 0. - Band correlation (Stereo Bands): the Correlation above, per octave
band (31 Hz to 16 kHz; each band Left and Right through the same 4th-order
Butterworth high- and low-pass at its edges), averaged with τ = 300 ms by
default. Width is
S²/(M²+S²)withM = (L+R)/2,S = (L−R)/2: 0 mono, ½ unrelated, 1 opposite polarity. Below −80 dBFS a band has neither. - Cycle correlation (the Phase Scope's number, not a measurement this page claims): Pearson between the main and Overlay Source's lows, below the Cycle correlation below frequency, about each one's mean, over the last whole Cycle. It answers "do kick and bass fit?", so it's named apart from the Correlation above.
- Spectrum: sine-calibrated (a 0 dBFS sine on a bin reads 0 dB, corrected for the window's coherent gain), the slope pivoted at 1 kHz, a Hann window by default.
How it's checked
- Every change: automated tests on signals we generate ourselves at 44.1, 48, 96 and 192 kHz. Tolerances: LUFS ±0.1 LU, LRA ±1 LU, true peak +0.2/−0.4 dB, sample peak ±0.01 dB, RMS ±0.05 dB, correlation ±0.02; a Spectrum sine on a bin ±0.1 dB.
- Before each release (from v0.1.0 on): the official EBU loudness test set (Tech 3341 and 3342) at 48 kHz, every stereo case with the tolerances above. The EBU files may not be redistributed, so they're downloaded by hand and never committed. Case 6 of Tech 3341 is 5.0 and 5.1 surround, which the stereo Loudness Meter doesn't measure.
There's no official certification, so there's no badge.
Known limits
- 192 kHz: true peak isn't oversampled there, so it's only a sample peak. The Loudness Meter then labels it Peak instead of TP, so it never claims more than it measures.
- System Capture measures what the system mixer plays. For levels straight from a DAW track, use a Send Plugin.
- A Spectrum sine half a bin off-centre reads up to 1.42 dB low (the Hann window's scalloping loss).
Tonal Balance and A/B
The Tonal Balance Meter tells you whether your mix's balance, from the sub to the air, sits where the songs you love sit, and A/B lets you hear the difference at the same loudness. This guide goes through it step by step; Meters ▸ Tonal Balance has every setting.
1. Add the Meter
Right-click any Meter and choose Add Meter ▸ Tonal Balance (or Change Meter ▸ Tonal Balance). It listens like every other Meter:
- System Capture: everything your computer plays. Simple, and it's what most Presets use.
- Send Plugins: put a Das-Meter Send on your DAW's master bus and pick it on the Meter. Then only your mix counts, not a notification sound or a video in the browser.
2. Add your reference songs
Pick a few finished songs that sound the way you want your mix to sound, ideally in the same style. Then:
- Right-click the Meter, Add files… ▸ Reference songs for the Target…, and pick the files (WAV, AIFF, FLAC, MP3, Ogg, AAC/M4A, ALAC), or
- drop the files, or a whole folder, on the Meter.
They're analysed in the background, far faster than playing them. Each song appears by its file name. No audio is copied: Das-Meter keeps each song's figures and where its file is.
No files? Learn a song… listens while you play a song from start to end; give it a name (or keep "Song 1") and Add.
3. Pick what to compare with
The picker at the top left of the Meter lists your songs. Pick one, or Average of all to compare with all of them together: then the purple range is how far your references differ from each other, a fair "anything in here is fine".
Only each song's loud parts count by default (its drops and choruses), so play the loud part of your mix too when you read the Meter.
4. Read it
Your mix is the line over the purple Target range:
- In the mix colour where it's inside the range: fine.
- Too much (red by default) or too little (blue) where it leaves it, judged over about a third of an octave, as the ear hears balance.
Below the curves: the loudest Sub and Bass notes, Low mono (how mono the low end is; under +0.8 is marked) and the crest of the Sub and Bass (how punchy), each next to the Target's.
Low end zooms into 20–300 Hz with a line on every note: a bass that's too loud on one note shows right away. If your song is in another key than the references, the Meter offers to Shift the Target's low end to your key, so the comparison stays note-sharp.
5. Listen A/B
When the song you compare with came from a file, A and B appear at the top right of the Meter.
- A is your mix.
- B plays the reference song, turned to your mix's loudness (the number next to "Hearing B" says by how much), so the louder one doesn't win just for being louder.
Switch as often as you like: the song keeps running silently on A, so B picks up at once, without a gap. While B plays you hear the song alone:
| Listening to | What goes quiet while B plays |
|---|---|
| Send Plugins | The Das-Meter Send the Meter listens to (it fades out and back in). |
| System Capture on macOS and Windows | Every other app, your DAW too. Only Das-Meter plays. |
| System Capture on Linux | Nothing yet: put a Das-Meter Send on the master bus, or stop playback. |
Everything plays again when you switch back to A, and if Das-Meter quits.
Loop the part you care about
Under the curves is the song's waveform, with a line where B is playing.
- Drag across it to choose a part, say the drop: B loops just that part.
- Click to play from a point to the end.
- Double-click for the whole song again.
See B in the Spectrum too
Turn on Show B in a Spectrum's menu: it draws B's spectrum as a grey layer, gain-matched to your mix, under your mix's own trace, while you hear either. Switch and watch where they part.
Tips
- Compare like with like: a drop with a drop, a verse with a verse.
- Trust your ears over the line: the Meter shows where to listen, A/B tells you whether it matters.
- Freeze keeps the curve as a ghost, to see what a change did.
- Add files… ▸ A bounce of your mix, to compare… compares a bounce instead of what's playing now.
Kick and bass in the Phase Scope
When a kick and a bass play their lows at the same time, they add up, or cancel each other out. Cancelling is why a low end can sound thin although both tracks sound fat on their own. The Phase Scope shows the two on top of each other, beat by beat, and says whether their lows fit. This guide uses two Das-Meter Sends, one on each track.
1. Put a Das-Meter Send on each track
In your DAW, add Das-Meter Send (CLAP, VST3 or AU) as an effect on:
- the kick track, and
- the bass track.
Each Send is named after its track and takes its colour, so you'll know them apart. Put them last in each track's chain (after EQ and compression), so they hear what you hear. See Send Plugins to install them.
2. Show the kick in a Phase Scope
- Right-click a Meter, Add Meter ▸ Phase Scope.
- In its menu, Listen to ▸ Send Plugins, and pick the kick's Send.
- Press play. The Phase Scope follows your DAW's tempo and beat, so the kick stands still on the beat. Pick Cycle ▸ Beat for one beat across the Meter, or Bar to see the whole bar.
3. Overlay the bass
In the Phase Scope's menu, pick Overlay Source ▸ the bass's Send. Now you see:
- the kick (the main trace),
- the bass over it, in its own Send's colour, placed by its own song position, so the two line up as they do in the song,
- their sum on top: what's actually left of the two together,
- and a lane under them: green where their lows push together, red where they cancel, stronger where they're louder.
The number above the waves is their Cycle correlation below 150 Hz: +1 when the lows move together, −1 when one is the other upside down, with what it means in words.
4. Make them fit
Turn on Suggestions. When the lows don't fit, the Phase Scope says what would help:
- Flip the bass's polarity: the bass's lows are upside down against the kick's. Use your DAW's phase/polarity button (Ø) on the bass, or the kick, and watch the lane turn green.
- Move the bass by so many ms: the bass's lows come a little early or late. Set that as the Phase Scope's Offset to hear and see it first, then delay (or advance) the bass track by that much in your DAW.
- Pitch it to match: the kick's tone and the bass's note are too far apart to ever line up; tune the kick to the bass's key.
Once they fit, it says Lows fit, in green, with the number. If nothing simple would help, it says that too, so every change gets an answer.
Why the sum matters
Listen to the sum line: when it's bigger than either wave, the low end hits harder; when it's smaller, you're losing it. A red lane right where the kick hits is the typical "my kick disappears when the bass plays".
Without Send Plugins
On System Capture there's only one Source (everything together), so there's nothing to overlay. Solo the kick and the bass in your DAW and watch the sum, or use the Sends as above.